Natural Resources Revenue Data has been a static site since its inception. At the time, static site generation was on the rise as an alternative to dynamic, database-driven websites. Static site generation was (and is) particularly suited to content-heavy sites with little or no user interaction in the form of commenting, ecommerce transactions, form submission, or profile management.
This has worked well for years. Static sites have several advantages over their dynamic counterparts, including structural simplicity, security, and – in theory, at least – performance. But we started to encounter some limitations.
“Source and transform nodes…”
When we migrated our codebase from Jekyll to GatsbyJS, we changed the way we query and update our site data. Basically, we changed our schedule and workflow from updating the site data once a year (using a Makefile and SQLite database) to querying an Excel file with GraphQL every time we build and deploy the site.
Our goal was to create a workflow that would:
- accommodate more frequent data updates (monthly)
- allow non-developers to update the site’s data (with little or no special software)
- maintain just one canonical data file for each dataset
While we successfully met each of these goals, we encountered significant downsides.
First, a static site must be compiled (built) before deployment, and our build times ballooned from just a few minutes to over 30 minutes, most of which time was spent processing these new data queries and subsequent transformations. This slowed down our development process and hindered our productivity.
Second, the builds taxed our local computer memory and that of our hosting service, Federalist, crashing builds and limiting the number of concurrent builds we could run.
Third, we’re transferring to the user’s computer all the data for a given page at once, as opposed to accessing from a database only what the user requests at any given time.
And finally, we’ve been contemplating the idea of adding lease-level data to the site (based on user research), which would include tens of thousands of additional data points. We weren’t going to be able to manage this much data with our current setup.
We needed another solution.
Static is still our JAM(Stack)
Among the evolutions of static site generation is the idea of the JAMStack (JavaScript, APIs, Markup) and content mesh. Basically, these concepts and associated technologies allow us to keep our front end static, prebuilt in roughly the same way it is now. We can then use APIs (Application Programming Interface) to pull in our site data from a database or third-party service.
This model gives us most of the flexibility and advantages of static sites, while allowing us to address the limitations of managing all of our data statically. So instead of incorporating our data and queries in our build process, we can abstract them out to a database and query layer, while keeping our front end mostly the same. We can structure and transform our data outside the build process, which cuts down on build time for our development team, and we can query data from the database on client request, which improves performance for users.
And while we’re still managing mostly static assets, that doesn’t mean we’re restricted to static content. More and more static site generators allow best-of-both-world static assets supplemented with dynamic content. To take advantage of this, we needed to configure an API to access our content.
Querying the data with GraphQL
We’re already using GraphQL in the context of Gatsby to query site data at build time, and the fact that we can use it to also query dynamic data is one of the reasons we chose Gatsby in the first place.
export const query = graphql`
  query BetaQuery {
   offshore_data:allMarkdownRemark (filter:{fileAbsolutePath: {regex: "/offshore_regions/"}} sort:{fields: [frontmatter___title], order: ASC}) {
      offshore_regions:edges {
        offshore_region:node {
          frontmatter {
            title
            unique_id
            permalink
            is_cropped
          }
        }
      }
    }
    states_data:allMarkdownRemark (filter:{fileAbsolutePath: {regex: "/states/"}} sort:{fields: [frontmatter___title], order: ASC}) {
      states:edges {
        state:node {
          frontmatter {
            title
            unique_id
            is_cropped
          }
        }
      }
    }
    OilVolumes:allProductVolumesMonthly (
      filter:{ProductName:{eq: "Oil"}}
      sort:{fields:[ProductionDate], order: DESC}
    ) {
      volumes:edges {
        data:node {
          LandCategory
          OnshoreOffshore
          Volume
          ProductionMonth
          DisplayMonth
          ProductionYear
          DisplayYear
          ProductionDate
          Units
          LongUnits
          ProductName
          LandCategory_OnshoreOffshore
        }
      }
    }
A portion of our homepage GraphQL query
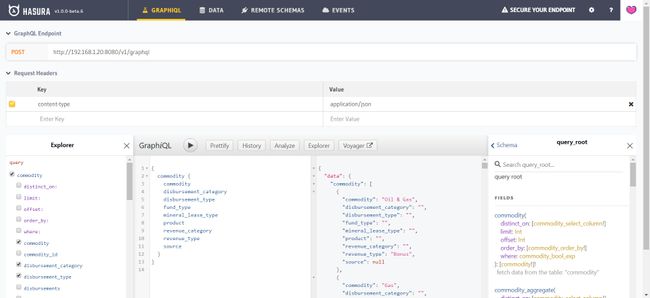
We selected Hasura for real-time GraphQL queries, which can render either server-side or client-side. Hasura provides a robust API for any schema, provided it can be migrated to a Postgres database. In addition, this model allows us to have one GraphQL schema that can serve and cache multiple data sources. It becomes the source of truth for all of our data queries.
There are multiple advantages to using Hasura as a real-time GraphQL service:
- explore and test queries with GraphiQL IDE (also available in Gatsby)
- ability to make dynamic API calls from the client
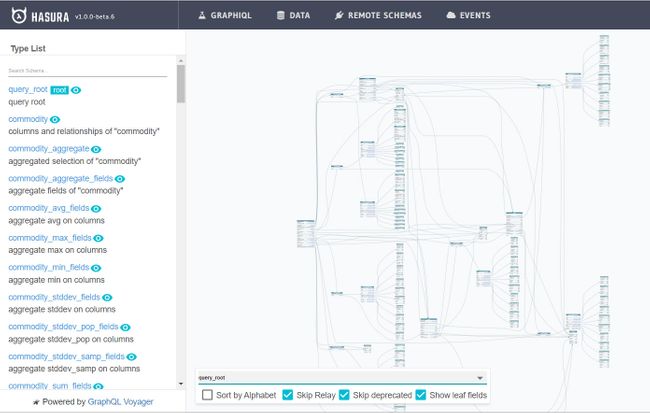
- visualize data structure and relationships
- summarize data and create custom data views
- access multiple outside services and data sources
- modify and update data through mutations
- manage user authentication to access data
Hasura allows us to store and customize our business logic in views, instead of hard-coding it in our app. This makes for a much more flexible developer experience, and we can test alternative presentations of the data without rewriting our code. With Hasura, we can also access multiple outside services and stitch them together seamlessly for users.
The GraphiQL IDE, where we can query our data with GraphQL
Storing and structuring the data
Since Hasura provides seamless integration to make a database available to Gatsby via GraphQL, it made sense to provide all the structured data through this interface. To accomplish this, we structured the data as a star schema within a database from the existing spreadsheets. This allows for flexible, simplified queries that match evolving business logic. We also realized performance gains through our data structure.
Our star schema consists of three fact tables: one each for revenue, disbursements, and production. From those, we have three dimension tables: period (when), location (where) and commodity (what). With this schema, we can easily and efficiently access or aggregate the data at the level we want.
Part of our data model, as visualized with GraphQL Voyager
Federalist to cloud.gov
Moving to a database means migrating away from our excellent static-site hosting service, Federalist. We were one of Federalist’s first customers, and it has been a reliable service that allows us to focus on our content instead of worrying about compliance and servers.
Thankfully, we have a database-friendly alternative in the form of cloud.gov. We get the same compliance benefits, but we’ll have the ability to host our Hasura and database services using Docker containers in the cloud.
Conclusion
We’re in the middle of all of this right now. We’ve configured our data within Hasura, but we have yet to migrate to cloud.gov and deploy the site using these services. We’ll share more as we go along, but you can track our progress at our GitHub repository.
 Open Data, Design, & Development at the Office of Natural Resources Revenue


